
'%3e%3cpath%20d='M13.1661442,23.7040134%20C13.1661442,33.4127119%2020.8223212,41.4221648%2029.9373041,41.4221648%20C30.8895192,41.4221648%2031.661442,40.6360427%2031.661442,39.6663119%20C31.661442,38.6965812%2030.8895192,37.9104591%2029.9373041,37.9104591%20C22.7478053,37.9104591%2016.6144201,31.4940635%2016.6144201,23.7040134%20C16.6144201,22.7342826%2015.8424972,21.9481605%2014.8902821,21.9481605%20C13.938067,21.9481605%2013.1661442,22.7342826%2013.1661442,23.7040134%20Z'%20id='cloud-bottom'%3e%3c/path%3e%3cpath%20d='M44.8275862,19.4318844%20C44.8275862,13.0791727%2040.0386234,7.88622948%2034.0752351,7.88622948%20C33.6351554,7.88622948%2033.1983199,7.91470823%2032.7665336,7.97103033%20C31.3593247,3.31853144%2027.2907721,0%2022.539185,0%20C17.7736197,0%2013.6984369,3.33716877%2012.3014972,8.00534911%20C11.7917866,7.92630591%2011.2743953,7.88622948%2010.7523511,7.88622948%20C4.7889628,7.88622948%200,13.0791727%200,19.4318844%20C0,24.3661171%202.91192551,28.7246489%207.20521659,30.3343253%20C8.09879781,30.6693542%209.08987745,30.2032332%209.41885493,29.2932149%20C9.7478324,28.3831965%209.29013064,27.3738863%208.39654942,27.0388574%20C5.47447735,25.9432899%203.44827586,22.9104981%203.44827586,19.4318844%20C3.44827586,14.9710794%206.74345049,11.3979352%2010.7523511,11.3979352%20C11.5357126,11.3979352%2012.3003454,11.5330394%2013.0278248,11.7953707%20C14.0592196,12.1672949%2015.1655426,11.4794103%2015.3119459,10.37516%20C15.834052,6.43716247%2018.9223047,3.51170569%2022.539185,3.51170569%20C26.1330952,3.51170569%2029.2078673,6.4007413%2029.7570805,10.3067548%20C29.9084393,11.3832217%2030.9744413,12.0621591%2031.9910868,11.7295951%20C32.6610632,11.5104332%2033.3603664,11.3979352%2034.0752351,11.3979352%20C38.0841357,11.3979352%2041.3793103,14.9710794%2041.3793103,19.4318844%20C41.3793103,22.7296955%2039.3631531,26.0485898%2036.7215336,27.2806853%20L36.4490453,27.4398299%20C35.7224015,27.9591565%2032.5072723,28.2397554%2030.0929958,27.4078638%20C26.5730243,26.194981%2024.3733805,23.0319574%2024.1364864,17.142331%20C24.0975143,16.1734127%2023.2946451,15.4201236%2022.3432279,15.4598126%20C21.3918107,15.4995015%2020.6521277,16.3171392%2020.6910998,17.2860574%20C20.9849621,24.5920191%2024.0805773,29.0434233%2028.9878245,30.7343222%20C32.2849959,31.8704344%2036.4892399,31.5442395%2038.27821,30.4160533%20C42.1035771,28.56458%2044.8275862,24.0326662%2044.8275862,19.4318844%20Z'%20id='cloud-top'%3e%3c/path%3e%3c/g%3e%3c/g%3e%3c/g%3e%3c/svg%3e)
The RESET Viral Index calculates the potential for infection based on the indoor air quality metrics that can be controlled by a building's or indoor space's air system and expresses it in one number.
- Initial Announcement: Click here to check out this post for the announcement.
- Webinar: Click here to watch the saved webinar.
- Presentation: Click here to download the RESET Index presentation shown in the webinar.
- 5 Minute Introduction to the Index: Click here to watch the 5 minute video.
- Click here to download the one-pager introduction.
- Click here to view the Sensirion Webinar: RESET Viral Index: From sensor data to actionable insight w/ Stanton Wong (2022/12/07)
The RESET Viral Index is currently a RESET Initiative. For early access to the white paper and algorithm, please consider becoming a grant sponsor.
The work of compiling and comparing research studies by our team is ongoing and can be accessed upon request. It will be made public after further peer review, with the goal of creating a feedback loop between scientists and building operators.
If you have any questions regarding the RESET Viral Index or questions about how to leverage it, please reach out to us at info[at]resetstandard.org.
Download the RESET Viral Index Whitepaper1. What is the RESET Viral Index
The RESET Viral Index informs how well a building is optimized in preventing airborne viral transmissions in an indoor space, leveraging research focused around virus transmission and applying it to continuous monitoring.
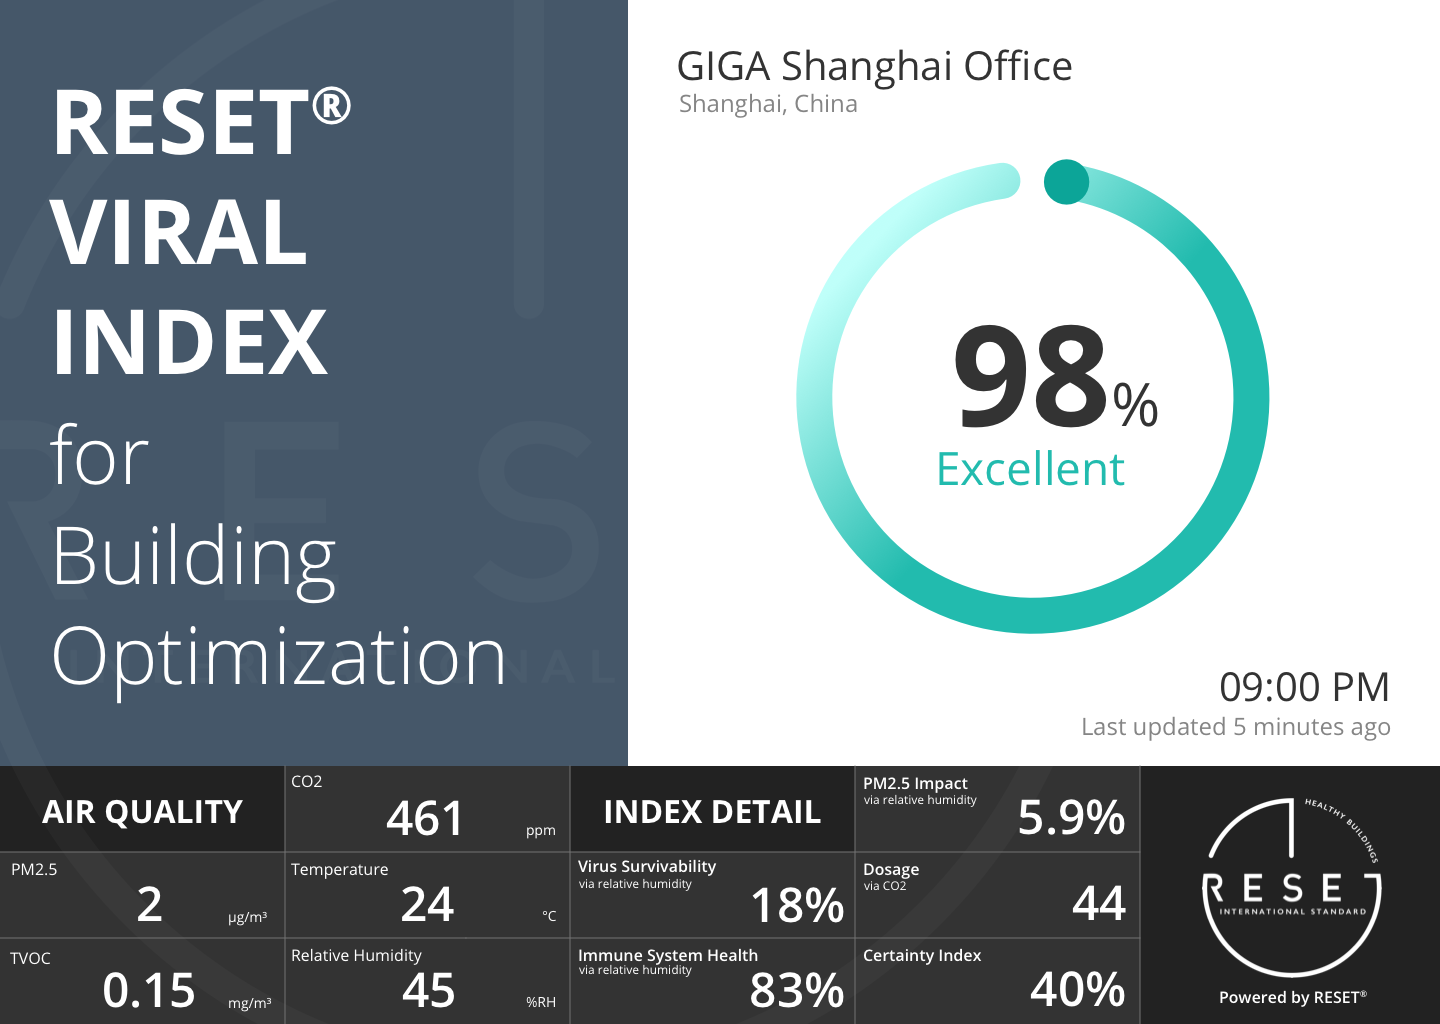
Image Above: A sample design of the RESET Viral Index Dashboard.
The RESET Viral Index breaks down and compiles research and data on virus survivability, the impact on immune system health, and exposure or dosage to calculate infection potential, all of which will provide insights into the outcome of operational decisions.
The research involved filtering through papers using air quality parameters (temperature, humidity, PM2.5 and CO2) that can be reliably detected by continuous monitoring technology. With that knowledge, we developed the following equation:

2. Using the RESET Viral Index
The RESET Viral Index is used to inform and optimize a building or indoor space to minimize airborne infection potential by providing insights in an easy to understand number.
When reading the index, 100% on the RESET Viral Index means that your indoor air quality has been fully optimized and the potential for airborne infection is minimized while 1% means that your indoor air quality is completely not optimized and the potential airborne infection if very high.
The RESET Viral Index provides building operators with an easy way to understand a building's air quality system's contribution to the reduction of potential infection via airborne (aerosol) pathways. It also can be used to highlight the spaces that already have systems in place that are operating to create the healthiest indoor space.
The image at the very top of the page is a sample design of a dashboard displaying the RESET Viral Index.
3. RESET Initiative and Grant Sponsors
The RESET Viral Index is a RESET Initiative. For early access to the white paper and algorithm, please consider becoming a grant sponsor.
The grant sponsor list will be updated as new sponsors fund the initiative.
Gold Sponsors
Silver Sponsors
4. Why we developed the RESET Viral Index
As an industry, we are doing remarkably few measurements and estimates of airborne concentrations of an airborne pathogen, especially when considering how infection rates are directly influenced by building air quality controls.
Since the beginning of 2020, a tidal wave of guidance has been provided by industry organizations on how to operate buildings during the SARS-CoV-2 pandemic. What has been lacking is empirical evidence.
When it exists, empirical evidence is the result of scientific research conducted in controlled laboratory settings with intentionally few variables. While requisite for research, it often makes the application of results to complex real-world scenarios challenging or impossible. This is further exacerbated when data from research is contradictory.
As a result, the answer to a simple question: “How do I know if a building is safe, right now?” ends up being highly complex and full of uncertainty.
This is especially true of indoor air quality and the ongoing fear of airborne transmission. “How do I know if the air is safe, right now?” is one of the most critical yet difficult questions to answer.
Although it is currently impossible to measure airborne viruses in real-time, it is possible to measure a building's ability to minimize the potential of infection from airborne (in particular, aerosol) transmission, in real-time, across a range of parameters. Doing so requires combining scientific research with real-time results in a standardized and meaningful way. And research has shown the direct impact of humidity, temperature, and airborne particulate matter on the rate of virus infections.
For solutions, the key lies in focusing on air quality variables that can be controlled and measured in both laboratory and indoor environments; temperature, humidity, carbon dioxide (CO2) and airborne particles. From there, it is then possible to factor in the impact of measured air changes or air cleaning rates.
The results are powerful: enabling users to gain insight into a indoor space's level of optimization based on a minimum of three or four indoor air quality metrics. As always however, the accuracy of the results are determined by the accuracy of the data being used: data quality is paramount.
For data quality, RESET's publicly available standards for hardware, software, installation, and project performance help provide a framework for tracking these parameters in a comparable manner so that the data can serve research, building operations, and communication efforts. The RESET Viral Index will be a tool that helps provide additional insight into balancing indoor air quality to minimize airborne viral transmission and provide an healthy indoor space.
5. FAQ
Check below for FAQ regarding the RESET Viral Index.
How do the Indexes work?
| What is the difference between the RESET Air Index and the RESET Viral Index? | The RESET Air Index leverages five indicators (PM2.5, CO2, TVOC, temperature, and relative humidity) to calculate an index that reflects how optimized an indoor space or building is for air quality holistically based on the RESET Air Standard, while the RESET Viral Index leverages four indicators (PM2.5, CO2, temperature, and humidity) to calculate an index that uses air quality as a proxy for understanding the likelihood of airborne virus infections in an indoor space. |
|---|---|
| How do the Indexes understand schools or other typologies? | Both indexes can apply to any typology and are typology agnostic. |
| The webinar mentioned that the RESET Viral Index will use rolling averages. How does the index handle rolling averages for spaces where HVAC systems that are not on 24/7? | The RESET Viral Index currently does not use rolling averages by default. It is possible to implement with rolling averages by plugging in rolling average data into the algorithm instead of the latest reading. In the case that rolling averages are used, the recommendation is to use only readings during the acknowledged operating hours to better reflect the air quality situation or when the space is occupied. |
What does the RESET Viral Index look like?
| How will the RESET Viral Index be accessed? | The RESET Viral Index will be built into the RESET Cloud for RESET Projects sometime in 2023. Additionally, other platforms can build the logic into their own platform for display and analytics using the algorithm written in the whitepaper. |
|---|---|
| Who will be able to access and see the RESET Viral Index? | The RESET Viral Index will be available for project teams to view in the RESET Cloud, but it will not be public unless the project team wants to make it so once the feature is available. It will also be available via other software platforms that build it into their systems. |
| Other than the indexes, is there any other information that will be displayed or provided? For example, suggestions to increase scores, optimize operations, adjust occupancy distribution, etc | At this point in time, only the indexes will be available. Optimization suggestions can be generally inferred, but specific suggestions will likely vary slightly based on the project. |
When will the RESET Viral Index be available?
| For current RESET projects on the RESET Cloud, when will the Indexes start being displayed? | The RESET Viral Index will be available in the RESET Cloud for RESET Projects sometime in 2023. Note that it will only be accessible to paid and active Data Audit projects on the RESET Cloud. |
|---|---|
| When is the RESET Viral Index going to be implemented on the software platforms of RESET Accredited Data Providers? | Some of the sponsors already have the RESET Viral Index built into their software platforms. |
| If a client is interested, what are the next steps? | There are a few options. One is to register and implement a RESET Project with RESET Air Accredited Monitors and a RESET Accredited Data Provider, and the RESET Viral Index will be available in the reporting. Otherwise, look for the Grant Sponsors who have implemented the RESET Viral Index onto their platforms. Lastly, you can always use the whitepaper to re-create the RESET Viral Index on your platform. For questions on collaboration, please reach out to us at info[at]resetstandard.org. |
| If a project already has an existing air quality monitor, what do they need to do to access the RESET Viral Index? | Most monitors will not inherently have the RESET Viral Index built in, but if the air quality monitor measure the 4 relevant parameters, then the data can be used either via a RESET Project or on a project that has the RESET Viral Index implemented. |
Costs and Fees
| What does the RESET Viral Index cost? | The RESET Viral Index, when it becomes available available, will be accessible at no additional cost for all RESET Projects that are registered and have paid for RESET Cloud's annual access. The RESET Viral Index can also be found on certain software platforms. Lastly, it can be implemented for free via the whitepaper, thanks to our sponsors! |
|---|
Monitoring Requirements
| Do I need special air quality monitors if I want to access the RESET Viral Index? | A normal air quality monitor that can track the 4 necessary parameters will be the base requirement. After that, it just comes down to how you get access to the RESET Viral Index. This can be in the form of a RESET Project, via another software platform that already has it implemented, or attempt to implement it yourself using the whitepaper. |
|---|---|
| How many air quality monitors would you recommend to monitor a 1,000 sqm (10,000 sq ft) office space? | Assuming it is an open office space, the RESET Air Standard would require at least two monitors. For more information on how this, we would recommend looking at the RESET Air Standard. |
References and Resources
| What research was leveraged for the RESET Viral Index? | Check out the Articles Cited section below. |
|---|---|
| For each field of research that the RESET Viral Index focuses on (for example, virus survivability and decay rates), you've looked at multiple research publications. Who's research findings have you found to be the best? | We don't place an opinion on who's research is best. We only evaluate who's research can be used, depending on available data and meta data that allow the results to be computed and compared. We also evaluate based on whether or not research results have been peer reviewed. Many estimators of indoor transmission choose single research results and list the choice in their assumptions. The RESET Viral Index takes a different path by using as much available research as possible to produce an average. It then looks at deviation from the mean to plot a precautionary outcome. The result being that the more research results and data entered into the calculations, the more the outliers get eliminated and the more precise the results, eliminating subjectivity. |
If there are any other questions, please do not hesitate to reach out to us at info[at]resetstandard.org.
6. Articles Cited
Over the past decade, RESET has focused on defining data quality and accuracy for building operations. As a result, when reviewing scientific literature related to airborne transmission, RESET's starting point was to identify variability between research results: a critical first step in defining uncertainty coming from scientific literature, to be added to levels of uncertainty collected from continuous monitoring.
Results were classified according to dominant research topics, inclusive of:
- Virus survivability
- Host's immune system health
- Dosage (quantity over time)
- Rates of transmission / infection
With research often being done in silos, results from the above topics only provide partial visibility on the environmental parameters driving or minimizing infection rates. Moreover, each research topic comes with its own level of uncertainty.
In order to translate these research topics into metrics applicable to building operations, the topics were organized into the following relational framework:
[Viral Survivability] + [Immune System Health] + [Dosage] = [Infection]
The above framework allowed for validation of the findings (inclusive of uncertainty) by comparing inputs on the left with outputs on the right. It also started to provide valuable insight into the contribution of each parameter to the risk of infection. Key findings will be published in a separate article.
Recognizing that viruses react differently to environmental parameters such as temperature and humidity, the above methodology was applied to Influenza, SARS-CoV-1 and SARS-CoV-2, as per available research studies.
Of 100+ research studies considered, 29 fit our research criteria and were incorporated into the development of the indicator. The contradiction in results from individual research studies led to the creation of a variability score, helping to transparently qualify the uncertainty in the final indicator. The results highlight opportunities for further research as well as the importance of having multiple researchers replicating a single study.
Check below for the research articles used to develop the RESET Indexes.
Virus Survivability - Aerosols
- Harper, G. 1961. Airborne Micro-Organisms: Survival Tests with Four Viruses. The Journal of Hygiene, 59(4), 479-486. https://www.jstor.org/stable/3861212
- Ijaz, M. K., Brunner, A. H., Sattar, S. A., Nair, R. C., & Johnson-Lussenburg, C. M. 1985. Survival characteristics of airborne human coronavirus 229E. The Journal of general virology, 66 ( Pt 12), 2743–2748. https://doi.org/10.1099/0022-1317-66-12-2743
- R. Eccles. 2002. An Explanation for the Seasonality of Acute Upper Respiratory Tract Viral Infections, Acta Oto-Laryngologica, 122:2, 183-191. https://doi.org/10.1080/00016480252814207
- Matthew E. Falagas, George Theocharis, Alex Spanos, Lambrini A. Vlara, Evangelos A. Issaris George Panos, George Peppas. 2008. Effect of meteorological variables on the incidence of respiratory tract infections. Respiratory medicine 102(5) 733-737. https://doi.org/10.1016/j.rmed.2007.12.010
- Casanova LM, Jeon S, Rutala WA, Weber DJ, Sobsey MD. 2010. Effects of air temperature and relative humidity on coronavirus survival on surfaces. Appl Environ Microbiol. 2010;76(9):2712-2717. https://doi.org/10.1128/AEM.02291-09
- John D. Noti ,Francoise M. Blachere,Cynthia M. McMillen,William G. Lindsley,Michael L. Kashon,Denzil R. Slaughter,Donald H. Beezhold. 2013. High Humidity Leads to Loss of Infectious Influenza Virus from Simulated Coughs. PLusOne. https://doi.org/10.1371/journal.pone.0057485
- Jennifer M. Reiman ,Biswadeep Das ,Gregory M. Sindberg,Mark D. Urban,Madeleine E. M. Hammerlund,Han B. Lee,Katie M. Spring,Jamie Lyman-Gingerich,Alex R. Generous,Tyler H. Koep,Kevin Ewing,Phil Lilja,Felicity T. Enders,Stephen C. Ekker,W. Charles Huskins,Hind J. Fadel,Chris Pierret. 2018. Humidity as a non-pharmaceutical intervention for Influenza A. POne Journals. https://doi.org/10.1371/journal.pone.0204337
- Peder Wolkoff. 2018. Indoor air humidity, air quality, and health – An overview. International Journal of Hygiene and Environmental Health 221(3), 376-390. https://doi.org/10.1016/j.ijheh.2018.01.015
- Neeltje van Doremalen, Trenton Bushmaker, Dylan Morris, Myndi Holbrook, Amandine Gamble, Brandi Williamson, Azaibi Tamin, Jennifer Harcourt, Natalie Thornburg, Susan Gerber, Jamie Lloyd-Smith, Emmie de Wit, Vincent Munster. 2020. Aerosol and surface stability of HCoV-19 (SARS-CoV-2) compared to SARS-CoV-1. N Engl J Med 2020; 382:1564-1567 https://doi.org/10.1056/NEJMc2004973
- Kaisen Lin, Linsey C. Marr. 2020. Humidity-Dependent Decay of Viruses, but Not Bacteria, in Aerosols and Droplets Follows Disinfection Kinetics. Environmental Science & Technology 2020 54 (2), 1024-1032. https://doi.org/10.1021/acs.est.9b04959
- Alyssa C Fears, William B Klimstra, Paul Duprex, Amy Hartman, Scott C. Weaver, Ken S. Plante, Divya Mirchandani, Jessica Plante, Patricia V. Aguilar, Diana Fernandez, Aysegul Nalca, Allison Totura, David Dyer, Brian Kearney, Matthew Lackemeyer, J. Kyle Bohannon, Reed Johnson, Robert F Garry, Doug S Reed, Chad J Roy. 2020. Comparative dynamic aerosol efficiencies of three emergent coronaviruses and the unusual persistence of SARS-CoV-2 in aerosol suspensions. medRxiv 2020.04.13.20063784; https://doi.org/10.1101/2020.04.13.20063784
Virus Survivability - Fomites
- Casanova LM, Jeon S, Rutala WA, Weber DJ, Sobsey MD. 2010. Effects of air temperature and relative humidity on coronavirus survival on surfaces. Appl Environ Microbiol. 2010;76(9):2712-2717. https://doi.org/10.1128/AEM.02291-09
- Alex Chin, Julie Chu, Mahen Perera, Kenrie Hui, Hui-Ling Yen, Michael Chan, Malik Peiris, Leo Poon. Stability of SARS-CoV-2 in different environmental conditions. 2020. The Lancet Microbe Vol.1, Issue1, E10, May 01, 2020 doi: https://doi.org/10.1016/S2666-5247(20)30003-3
Immune System
- A V Arundel, E M Sterling, J H Biggin, and T D Sterling. 1986. Indirect Health Effects of Relative Humidity in Indoor Environments. Environmental Health Perspectives, March 1986, Vol.65. https://doi.org/10.1289/ehp.8665351
- Peder Wolkoff. 2018. Indoor air humidity, air quality, and health – An overview. International Journal of Hygiene and Environmental Health 221(3), 376-390. https://doi.org/10.1016/j.ijheh.2018.01.015
Dosage
- J.W. Tang, Y. Li, I. Eames, P.K.S. Chan, G.L. Ridgway. 2006. Factors involved in the aerosol transmission of infection and control of ventilation in healthcare premises. Journal of Hospital Infection Vol.64, Issue 2, October 2006, Pages 100-114. https://doi.org/10.1016/j.jhin.2006.05.022
- James Atkinson, Yves Chartier, Carmen Lúcia Pessoa-Silva, Paul Jensen, Yuguo Li, Wing-Hong Seto. 2009. Natural Ventilation for Infection Control in Health-Care Settings. Annex C Respiratory Droplets. World Health Organisation 2009. https://www.ncbi.nlm.nih.gov/books/NBK143281/
- Lindsley, W. G., Blachere, F. M., Beezhold, D. H., Thewlis, R. E., Noorbakhsh, B., Othumpangat, S., Goldsmith, W. T., McMillen, C. M., Andrew, M. E., Burrell, C. N., & Noti, J. D. 2016. Viable influenza A virus in airborne particles expelled during coughs versus exhalations. Influenza and other respiratory viruses, 10(5), 404–413. https://doi.org/10.1111/irv.12390
- Sima Asadi, Anthony S. Wexler, Christopher D. Cappa, Santiago Barreda, Nicole M. Bouvier & William D. Ristenpart. 2019. Aerosol emission and superemission during human speech increase with voice loudness. Sci Rep 9, 2348 (2019). https://doi.org/10.1038/s41598-019-38808-z
- Online Article; Science Media Center. 2020. Expert Reaction to Questions about COVID-19 and Viral Load. https://www.journalofhospitalinfection.com/article/S0195-6701(06)00286-6/fulltext
- G.Buonanno, L.Stabile, L.Morawska. 2020. Estimation of airborne viral emission: quanta emission rate of SARS-CoV-2 for 2 infection risk assessment. Environment International Vol.141, August 2020, 105794. https://doi.org/10.1016/j.envint.2020.105794
- Giorgio Buonanno, Lidia Morawska, Luca Stabile. 2020. Quantitative assessment of the risk of airborne transmission of SARS-CoV-2 infection: prospective and retrospective applications medRxiv 2020.06.01.20118984. https://doi.org/10.1101/2020.06.01.20118984
Infection Rates
- Thomas A. Kenyon, M.D., M.P.H., Sarah E. Valway, D.M.D., M.P.H., Walter W. Ihle, M.P.A., Ida M. Onorato, M.D., and Kenneth G. Castro, M.D. 1996. Transmission of Multidrug-Resistant Mycobacterium tuberculosis during a Long Airplane Flight. N Engl J Med 1996; 334:933-938. https:/doi.org/10.1056/NEJM199604113341501
- Siegel, J. D, Rhinehart, E, Jackson, M, Chiarello, L, & Health Care Infection Control Practices Advisory Committee. 2007. 2007 Guideline for Isolation Precautions: Preventing Transmission of Infectious Agents in Health Care Settings. American journal of infection control, 35(10 Suppl 2), S65–S164. https://doi.org/10.1016/j.ajic.2007.10.007
- Anice C. Lowen, John Steel. 2014. Roles of Humidity and Temperature in Shaping Influenza Seasonality. Journal of Virology Jun 2014, 88 (14) 7692-7695; https://doi.org/10.1128/JVI.03544-13
- Miyu Moriyama, Takeshi Ichinohe. 2018. High ambient temperature dampens adaptive immune responses to influenza A virus infection. Proceedings of the National Academy of Sciences Feb 2019, 116 (8) 3118-3125; https://doi.org/10.1073/pnas.1815029116
- Eriko Kudo, Eric Song, Laura J. Yockey, Tasfia Rakib, Patrick W. Wong, Robert J. Homer, Akiko Iwasaki. 2018. Low ambient humidity impairs barrier function and innate resistance against influenza infection. Proceedings of the National Academy of Sciences May 2019, 116 (22) 10905-10910; https://doi.org/10.1073/pnas.1902840116
Exposure to PM2.5
- Cindy Feng, Jian Li, Wenjie Sun, Yi Zhang, Quanyi Wang. 2016. Impact of ambient fine particulate matter (PM ) exposure on the risk of influenza-like-illness: a time-series analysis in Beijing, China. Environ Health 15, 17 (2016). https://doi.org/10.1186/s12940-016-0115-2
- Leonardo Setti, Fabrizio Passarini, Gianluigi De Gennaro, Pierluigi Baribieri, Maria Grazia Perrone, Massimo Borelli, Jolanda Palmisani, Alessia Di Gilio, Valentina Torboli, Alberto Pallavicini, Maurizio Ruscio, PRISCO PISCITELLI, Alessandro Miani. 2020. SARS-Cov-2 RNA Found on Particulate Matter of Bergamo in Northern Italy: First Preliminary Evidence. Environmental Research Vol.188, September 2020, 109754. https://doi.org/10.1016/j.envres.2020.109754
- Leonardo Setti, Fabrizio Passarini, Gianluigi De Gennaro, Pierluigi Barbieri, Maria Grazia Perrone, Andrea Piazzalunga, Massimo Borelli, Jolanda Palmisani, Alessia Di Gilio, PRISCO PISCITELLI, Alessandro Miani. 2020. The Potential role of Particulate Matter in the Spreading of COVID-19 in Northern Italy: First Evidence-based Research Hypotheses. medRxiv 2020.04.11.20061713. https://doi.org/10.1101/2020.04.11.20061713 [*NOTE - This article is a preprint and has not been peer-reviewed. It reports new medical research that has yet to be evaluated and so should not be used to guide clinical practice.]
- Yongjian Zhu, Jingui Xie, Fengming Huang, Liqing Cao. 2020. Association between short-term exposure to air pollution and COVID-19 infection: Evidence from China. Science of The Total Environment Vol.727, 20 July 2020, 138704. https://doi.org/10.1016/j.scitotenv.2020.138704
- Xiao Wu, Rachel C. Nethery, Benjamin M. Sabath, Danielle Braun, Francesca Dominici. 2020. Exposure to air pollution and COVID-19 mortality in the United States: A nationwide cross-sectional study. medRxiv 2020.04.05.20054502; https://doi.org/10.1101/2020.04.05.20054502 [*NOTE - This article is a preprint and has not been peer-reviewed. It reports new medical research that has yet to be evaluated and so should not be used to guide clinical practice.]
- José L. Domingoa, Joaquim Roviraa. 2020. Effects of air pollutants on the transmission and severity of respiratory viral infections. Environmental Research Vol.187, August 2020, 109650. https://doi.org/10.1016/j.envres.2020.109650
- Edoardo Conticini, Bruno Frediani, Dario Caro. 2020. Can atmospheric pollution be considered a co-factor in extremely high level of SARS-CoV-2 lethality in Northern Italy? Environmental Pollution Vol. 261, June 2020, 114465. https://doi.org/10.1016/j.envpol.2020.114465
- Marco Travaglio, Yizhou Yu, Rebeka Popovic, Liza Selley, Nuno Santos Leal, L. Miguel Martins. 2020. Links between air pollution and COVID-19 in England. medRxiv 2020.04.16.20067405. https://doi.org/10.1101/2020.04.16.20067405 [*NOTE - This article is a preprint and has not been peer-reviewed. It reports new medical research that has yet to be evaluated and so should not be used to guide clinical practice.]
- Mario Coccia. 2020. Two mechanisms for accelerated diffusion of COVID-19 outbreaks in regions with high intensity of population and polluting industrialization: the air pollution-to-human and human-to-human transmission dynamics. medRxiv 2020.04.06.20055657. https://doi.org/10.1101/2020.04.06.20055657 [*NOTE - This article is a preprint and has not been peer-reviewed. It reports new medical research that has yet to be evaluated and so should not be used to guide clinical practice.]
7. Download the RESET Viral Index Whitepaper
All of the PDFs for the RESET Viral Index Whitepaper can be found below: